Election results come down to two factors — which individuals will vote, and whom they will vote for — resulting in two parallel objectives for political advocacy groups and campaigns. …
The 2021 statewide elections in Virginia and New Jersey each resulted in similar rightward swings in support of about 6 points overall, or a 12-point swing. Immediately following the election, Civis analyzed aggregate election results; in this post, we use our Biden Support score and vote histories released by election officials in Virginia and New Jersey to unpack the relative impacts of changing electorates and changing vote choice on the overall outcomes in each race.
Key takeaways:
- Persuasion: Persuasion and vote-switching played a significant role in the shifts observed from 2017 to 2021, and even more so in those from 2020 to 2021.
- Turnout: Republican turnout was meaningfully higher in 2021 than in 2017, largely coinciding with increases in turnout in white and rural areas.
- Drop-Off Voters: Of the shifts in turnout that we do see, voter drop-off is a much bigger factor in changing electoral outcomes than a surge of new voters. Republicans successfully remobilized Trump 2020 voters while more 2020 Biden voters stayed home. Remobilizing these voters in 2022 represents a significant number of potential Democratic votes.
Democratic turnout grew while Republicans surged
Key takeaway: Republican turnout was meaningfully higher in 2021 than in 2017, coinciding with increases in turnout in White and rural areas.
Democratic turnout was generally strong in both Virginia and New Jersey, but Republican turnout significantly exceeded expectations based on past cycles. Republican turnout in Virginia nearly matched 2020 turnout, already a historically high-turnout election. The chart below shows that voter file turnout rates (meaning the percentage of registered voters who participated in the election) grew significantly more in Virginia’s most Republican precincts and less in the state’s most Democratic ones. Similar patterns hold at the district level in New Jersey.

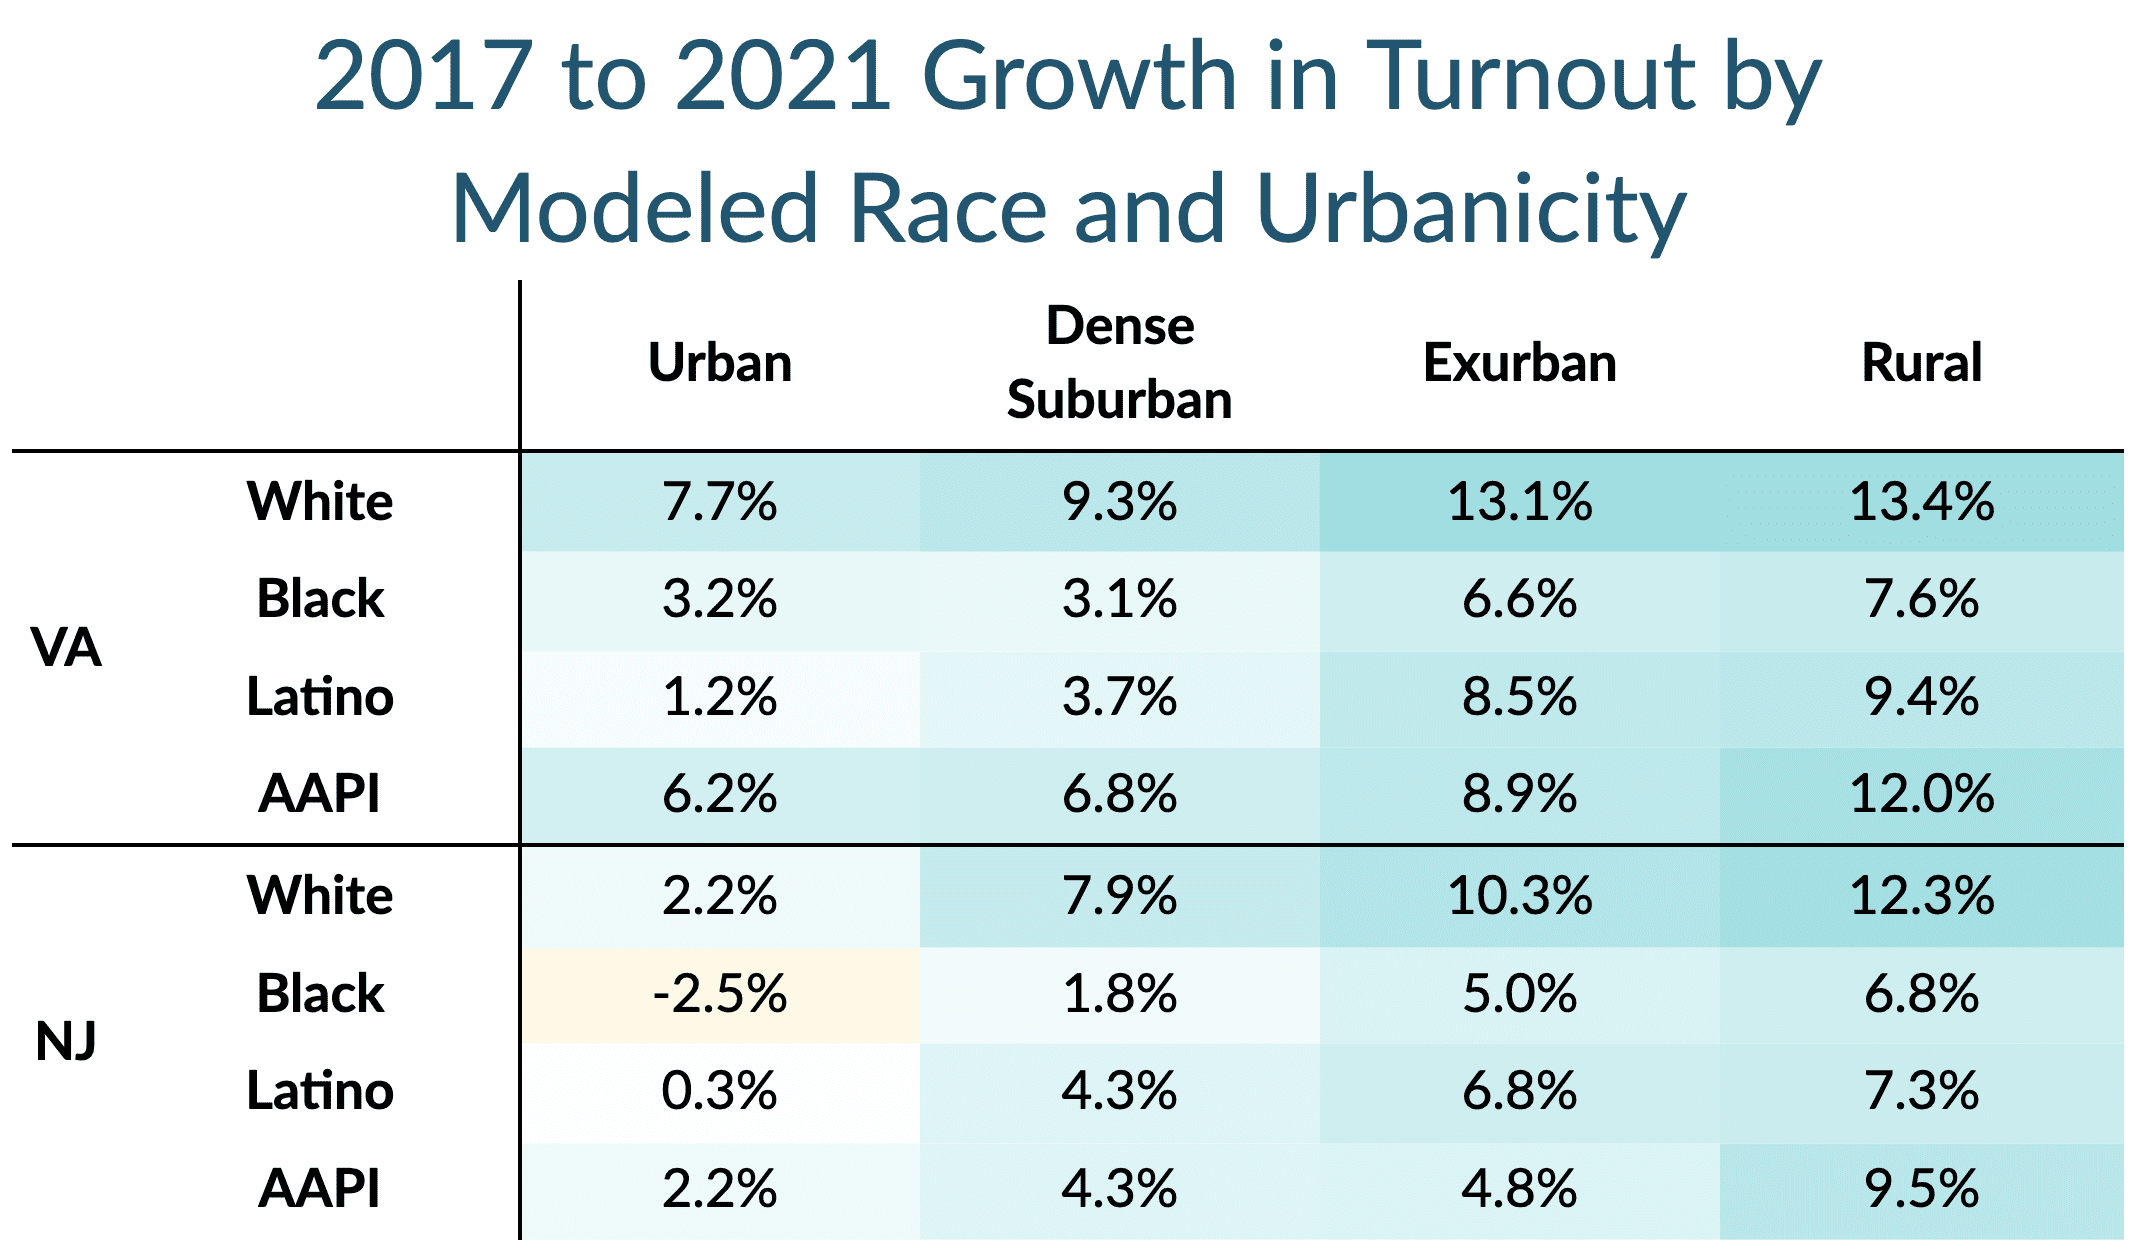
In both states, turnout grew across the board, but spiked most in the Whitest, most rural areas and grew least in more urban areas and those with more voters of color. Rural and exurban White voters increased turnout rates by double-digit percentages, while turnout among urban and dense suburban voters grew less. Black, Latino, and AAPI voters in more rural areas also saw increased turnout from 2017.

The table above shows growth in individual-level turnout rates from 2017 to 2021 broken out by the New York Times urbanicity model (more here) and the Civis race/ethnicity model.
The composition of the electorate changed meaningfully, but not enough to explain the entirety of the significant shifts in voting outcome from 2017 to 2021 or 2020 to 2021.
Post-2020 vote-switching was a significant factor in both races
Key takeaway: While voter turnout was a significant factor in the strong 2021 Republican performance, individual vote history data indicates that persuasion, or vote-switching, accounted for about four times as much of the overall shifts in outcomes.
Next, we use our Civis 2020 Biden Support Score and vote history data from the Virginia and New Jersey election officials to consider the relative impact of turnout and vote-switching on the results of the gubernatorial race in each state.
Here is how we break out each factor:
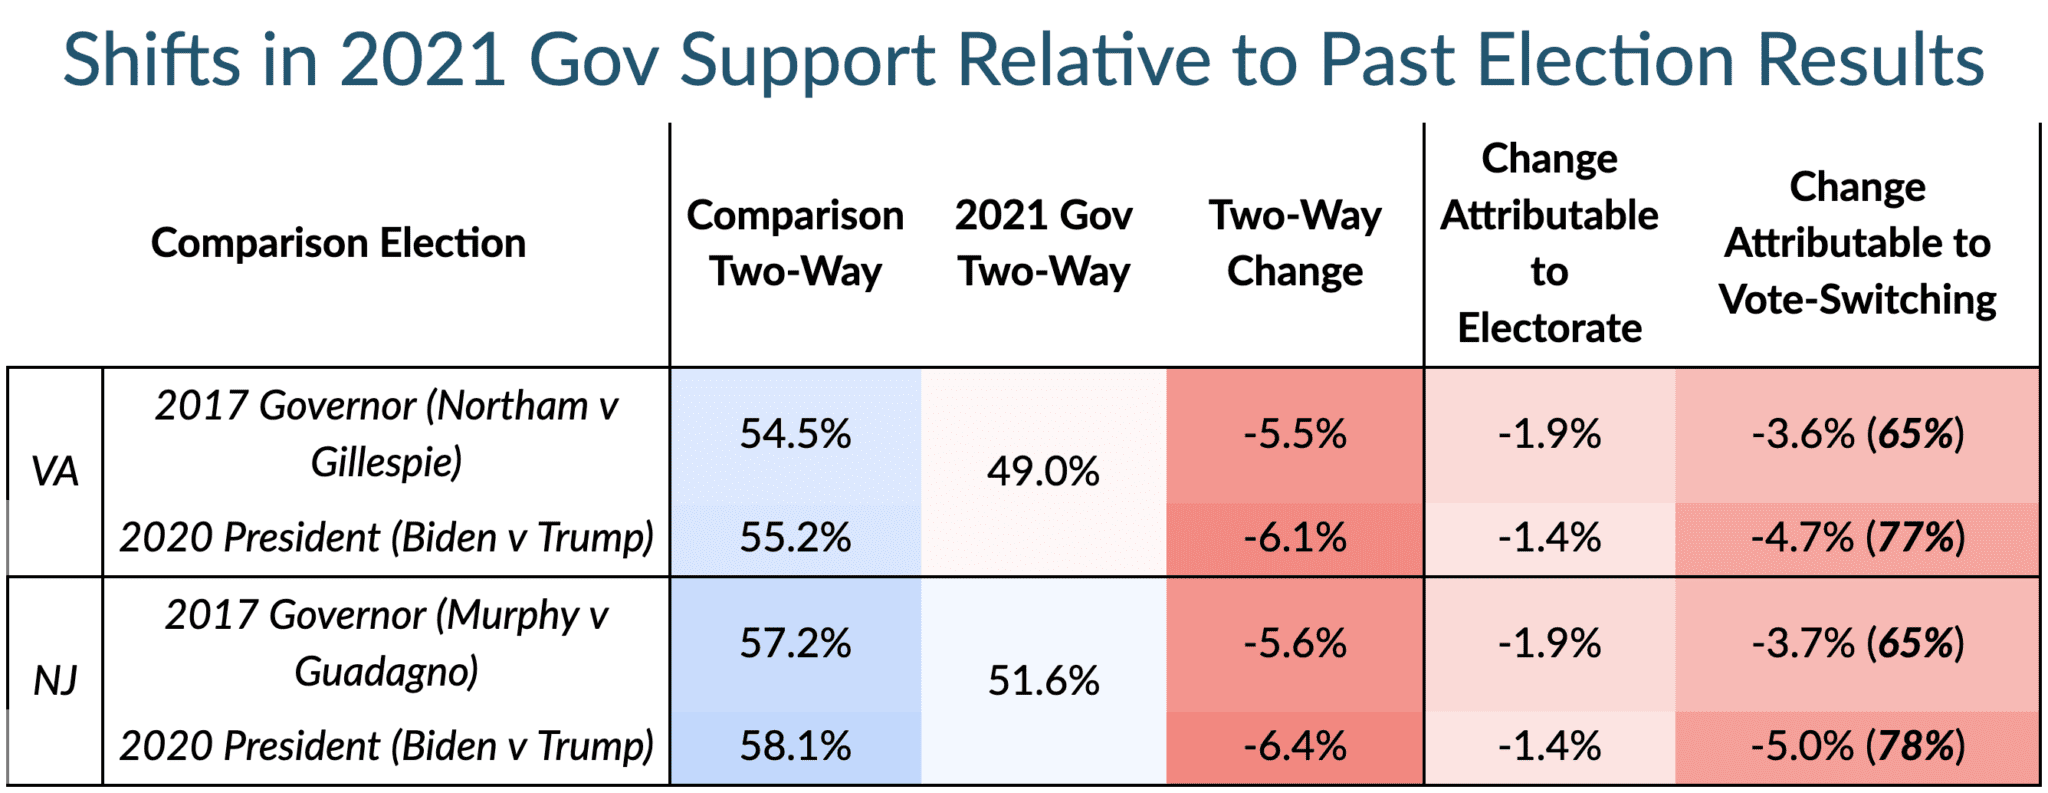
- Change Attributable to Electorate is calculated by analyzing our Biden support model among people who voted in each election. Modeled Biden support among 2021 voters compared to modeled Biden support among 2020 voters tells us how much of the change in overall support is due to different people voting in this election than the last one.
- Change Attributable to Vote-Switching is the remaining difference between the overall shift and the amount of shift we can attribute to turnout.
Vote switching accounts for about 80% of the shifts in each state from Biden in 2020 to the Democratic candidates for governor in 2021. Changes in turnout only account for about two-tenths of overall movement1. In terms of the final margin, a switched vote is worth twice as much to the recipient because one side loses a vote while the other side gains one.

The table above shows that a meaningful number of people changed their minds between Election Day 2020 and Election Day 2021. Targeted persuasion campaigns in 2022 should invest in message testing to scale the most persuasive, mobilizing ads for the target audience and avoid those that mobilize opponents.
Gen Z and Millennial Democrats didn’t turn out post-2020
Biden Support Scores, combined with individual-level vote histories, show young voters and voters of color swung most against Democrats due to changes in the composition of the electorate.
In both Virginia and New Jersey, young voters play a slightly complicated role in the electorate. Gen Z voters are aging into the electorate and mobilizing, but also saw the highest turnout drop-off between 2020 and 2021. The young voters who did turn out were much more Republican than in previous cycles.
The charts below show modeled Biden support by generation for those who voted in 2020 and those who voted in 2021 (people who voted in both elections are counted each year). In Virginia, Gen Z voters who turned out in 2020 were about 6 points more likely to be Biden supporters than the Gen Z electorate in 2021. In older generation cohorts, this gap closes as the 2021 electorate was about as strong for Biden as was the 2020 electorate.

Programs targeting younger voters, especially in lower-turnout scenarios, should do careful research to ensure individual-level mobilization targets are not counterproductive.
New Latino and AAPI voters shifted each group to the right
The other two groups among which 2021 voters were significantly to the right of past electorates are Latino and AAPI voters. Unlike the pattern described for young voters, new Latino, Black, and AAPI entrants into the electorate in 2021 — voters who stayed home in 2020 but voted in 2021 — were significantly more likely to be Trump supporters than other Latino and AAPI voters.
The tables below break out modeled Biden Support by race among three types of voters:
- Consistent: Voted in 2020 AND 2021
- Surge: Voted in 2021 but NOT 2020
- Drop-Off: Voted in 2020 but NOT 2021
Consistent and Drop-Off Black, Latino, and AAPI voters show similarly strong levels of support for Joe Biden in both Virginia and New Jersey while White support, as expected, is much lower. However, Surge Black, Latino, and AAPI voters show significantly lower levels of modeled Biden support.

2020 drop-off voters are valuable GOTV targets
Key Takeaway: A large segment of recently active voters are modeled to have supported Joe Biden in 2020, but may need some encouragement to turn out in 2022.
Only a small portion of the change in the electorate is due to new voters turning out in 2021 who did not vote in 2020 (5% in VA and 6% in NJ). Vote drop-off (turning out in 2020 but not 2021) is much more common.
Democrats would have netted about 60k votes commonwealth-wide in Virginia and 182k votes statewide in New Jersey if every drop-off voter turned out and supported 2021 Democrats to the degree they supported Biden. Drop-off does not account for Virginia Governor Glenn Youngkin’s entire margin of victory, but remobilizing these voters in the midterms represents a significant pool of available Democratic votes.
Balancing the size and Democratic lean of each subgroup in our analysis, voters of color, younger voters, and urban voters represent the greatest number of potential votes — those who are likely to support Democrats if they turn out.
This is because partisanship among drop-off voters in these demographics is significantly more Democratic than the Surge voters presented in the previous sections. For a more complete demographic breakdown of this audience, please reach out and we’re happy to provide more detailed counts.
Republicans may have not yet maxed out their turnout potential, but Democrats have significant potential to net votes through targeted get-out-the-vote [GOTV] efforts across broad demographic segments who turned out fairly recently to vote in an election.
Conclusions and Takeaways
The 2021 elections in New Jersey and Virginia illustrated the shifting dynamics of the Democratic coalition in each state. Changes in the turnout environment converged with vote switching to shift statewide election results about 6 points to the right in each state along with significant swings in their respective legislatures.
As organizations and campaigns approach 2022, it’s never been more important to test messaging and ensure that you’re investing the most in the messages that are most persuasive to the voters most likely to influence the outcome.
Footnote
- Turnout appears to play a larger role when comparing 2021 to 2017 because there is more time for changes in the electorate to take place. Simply put: typically more people can move into and out of a state (or age into or out of the electorate) in four years than one year so changes in who voted are amplified. In a previous post about the New Jersey State Senate results compared to 2017, we attribute about half the shift in outcomes to changes in the electorate. This analysis uses our Biden support score and compares shifts from 2020 to 2021.


