We are excited to announce the launch of SQL-based reporting in Civis Platform! This feature enables you to quickly create reports based on your data in Civis Platform without needing…
Civis’s political data science team has gotten a number of questions since the midterm elections, so we wanted to share some of our insights more broadly given the widespread interest.
There are three aspects of the results that stood out to us: (1) turnout, which dramatically exceeded that of an average midterm year, (2) change in overall vote share, with Democrats gaining substantial ground in districts that swung toward President Trump in 2016, and (3) incumbency effects, which were substantially diminished for Republicans this year.
Our main methodological takeaway this cycle is that large-scale, web-based polling is the most accurate way to guide political resource allocation, messaging decisions, and targeting. We’ll show you why below.
But first, the insights. Here’s what we learned:
1. Turnout broke records across the country.
In most midterm election years, we expect to see total turnout levels that are far below those of Presidential elections. This year, turnout significantly outperformed its 2014 levels in every state. In Montana, turnout exceeded 2016 levels, while in Texas and North Dakota, it was nearly as high.
In 2018, state-level turnout approached 80% of 2016 turnout in most states. By comparison, in 2014, turnout was only 65% of what it was in the most recent Presidential year.

2. Districts that swung toward Trump in 2016 came back to Democrats at high rates.
When thinking about how districts changed, we typically talk about electoral “swing” — or change in party vote share — between two points in time. In 2016, we saw that a lot of districts that had voted for President Obama in 2012 were less supportive of Hillary Clinton. This cycle, nearly every district swung back toward Democrats and, more importantly, over 85% of the districts that swung away in 2016 swung back, even if only by a small amount. In other words, the electorate became less polarized in more Republican districts — even though many of these ended up being places that Republicans ultimately held in 2018.
Interestingly, though, Democrats lost relative vote share in 30% of districts that Clinton won. This makes sense: across the board, we would expect midterm elections to be less nationalized — and less polarized — than Presidentials.

These trends are especially evident looking at the coalitions each party ended up with in the House. Democratic base districts — those that voted for Obama in 2012 and then Clinton in 2016 — made up about 82% of seats held by Democrats, using votes tallied as of today. By contrast, Republican base districts made up 95% of Republican seats, showing how Republicans lost ground in all but the reddest districts.

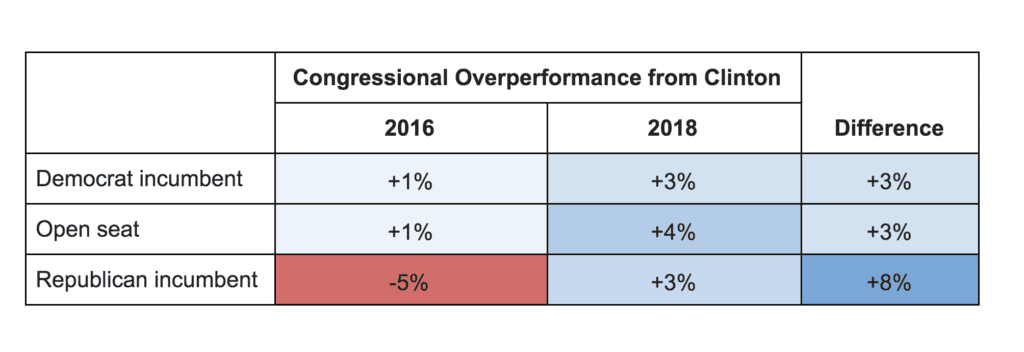
3. Typically, incumbents fare better in elections, but this year, that effect was weaker for Republican incumbents.
This is a big deal. In competitive seats — those where the ultimate margin was within 10 points — Democrats voted out Republican incumbents at higher rates, bucking tradition.
Relative to Congressional performance in 2016, Democrats in these districts performed about 3% better in seats where no incumbent was running in 2018, or where there was a Democratic incumbent. However, they did about 8% better in districts where there was a Republican incumbent. In other words, Democrats were able to make major gains in districts that in other years would have been safe Republican holds.

And here’s what we learned at Civis about the science:
Robust online polling helped us fix the measurement errors of 2016.
Large-scale, “always-on” web polling enabled us to collect more than 1 million surveys this cycle and build accurate models at each geographic level — from the state down to the state legislative district. In total, we built models for 5K+ individual races — and refreshed them weekly! These models helped us target the right races, identify the best messages, and improve on-the-ground, TV and digital targeting.
In the end, this investment paid off, producing highly accurate forecasts. We correctly forecasted the winner in 383 out of 394 contested races (97%), and our estimate of the national popular vote was accurate to within tenths of a percent. Here are our projections vs. the outcomes by Congressional district:

Our goal this year was “no surprises.” We believe our new web-based tools helped us achieve this goal, and we plan to build on these investments to further improve accuracy and reduce data collection costs for the future.

