For a version of this post with interactive maps, check it out on GitHub. Introduction Oftentimes, when working with public data, there will be a geospatial component to the data —…
No one likes being dependent on someone else for their day-to-day work. It leads to inefficiencies, a cycle of endless change requests, and a general feeling of powerlessness.
Unfortunately, this type of dependency often occurs when data scientists and decision-makers are working together to tackle a problem. Data scientists hold the keys to data stored in complex databases, as well as the tool sets for analysis, so non-technical decision-makers have to send requests for new models, analyses, and visualizations that they cannot produce themselves.
At Civis, we love it when users ask data-driven questions. However, we seek to avoid the dreaded situation of dependency as much as possible by building tools that hand over data to business users and key decision-makers. They can explore trends and generate insights without depending on data scientists, providing data teams resources to improve their data pipelines, test out new models, and implement better approaches to analysis and visualization.
The Problem
My team recently found ourselves with a dependency problem. We partner with our client to conduct weekly survey research, measuring KPIs such as brand sentiment, product usage and consideration, understanding and awareness of new features, and other data for strategic decision making.
Our client is very data-driven and technically savvy, which leads them to request many complex survey questions that cannot be answered with a single static memo or presentation. Rather, Civis has developed custom analysis methods and visualizations over multiple years. Since our client could not independently explore the data, Civis Applied Data Scientists had to generate custom tables and visualizations through multiple iterations of analysis and feedback, which led to inefficiency.
The Solution
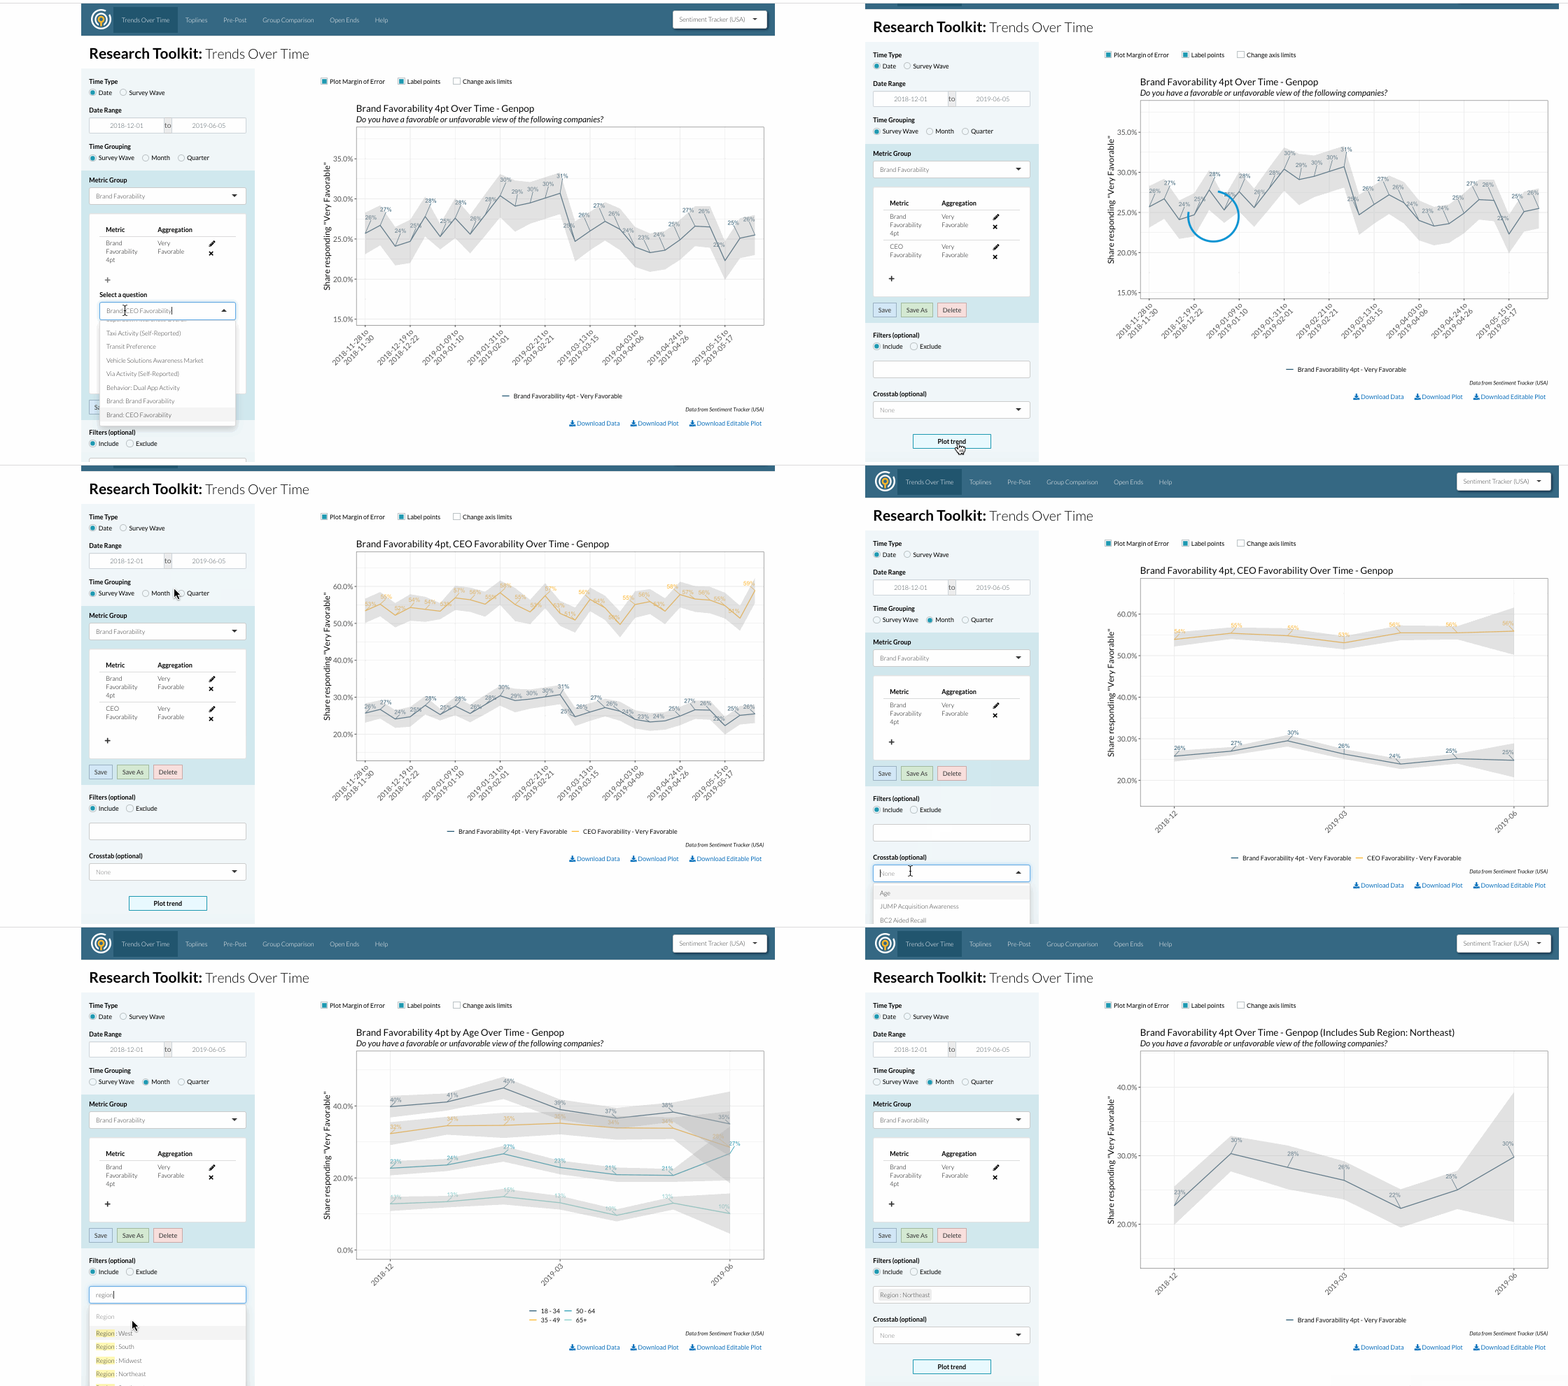
Realizing that we needed a way to give decision-makers the ability to explore the data and answer key questions quickly and directly, my team invested the past several months in building a custom application, Research Toolkit. Research Toolkit is a custom R Shiny application, hosted in Civis Platform, which has transformed the way that our team collaborates with our client.
As we collect new survey data, the responses are automatically fed into Research Toolkit, where our client can easily track key metrics and identify important trends. When we add a new question to the survey, the data is readily available for our client. They can immediately answer business questions and generate visualizations of the findings to present to key stakeholders. Rather than having the Civis team analyze the data based on our understanding of the business questions and then coming back with follow-up requests, our client now has an uninterrupted workflow of data exploration and analysis, all without writing a single line of code.

Best Practices
In the last few months of building Research Toolkit, my team has ventured into the realm of product development and gathered some best practices for building applications for data scientists and business users.
- Give your user something to react to. At first, we tried to choose an MVP set of features using a long written document listing out over a dozen possible ideas for types of analyses and visualizations. However, it was most beneficial to use our own expertise to design an MVP of the tool to get in the hands of our users in a short amount of time. As our client provided live feedback on the roadblocks they were encountering with the MVP and second-level problems they wanted to solve, we could immediately take that data and let it define what we built in our second and third versions.
- Partnership, not perfection. As a team developing a product, there is a desire to wait until you have developed every feature and worked out every bug before sharing the result with your end user. However, this means that you lose valuable time that you could be getting feedback and could end up building features that your users might not actually need. Our close partnership with our client instead allowed us to deliver early iterations of the tool even when we knew it wasn’t perfect. Their willingness to use a work-in-progress tool and work through the development process together enabled us to ultimately build something more useful, on a faster timeline.
- Communication and clarity are key. Data science is unique in that there are many stakeholders for data-driven insights across an organization. Through user interviews, we learned that our client was sharing the insights generated by Civis research with many individuals across the organization who required very clear understanding of the key takeaways from the analysis. Hearing this feedback, we introduced additional features like question descriptions, captions, and margins of error to ensure that our client can clearly communicate their message.
- Have empathy for your user. One very fortunate thing about Research Toolkit was that we were not building for an unknown, far-away user. Not only had members of my team interacted with our client on a daily basis for months (and, in some cases, years), but we were also using Research Toolkit ourselves on a regular basis. In doing so, we would hit many of the same roadblocks that our users encountered. Experiencing a bug or discovering a missing feature firsthand created empathy for our users, which would have been more difficult to foster through email or phone conversations alone. Using Research Toolkit every day reminds us what we are building towards, making us better at both teaching and building.


