After an information-packed three days, the 2023 Bridge conference has come to a close. One of our biggest takeaways from the conference was that nonprofits across the country, in virtually…
Mario Kart was a staple of my childhood — my friends and I would spend hours after school as Mario, Luigi, and other characters from the Nintendo universe racing around cartoonish tracks and lobbing pixelated bananas at each other. One thing that always vexed our little group of would-be speedsters was the question of which character was best. Some people swore by zippy Yoshi, others argued that big, heavy Bowser was the best option. Back then there were only eight options to choose from; fast forward to the current iteration of the Mario Kart franchise and the question is even more complicated because you can select different karts and tires to go with your character. My Mario Kart reflexes aren’t what they used to be, but I am better at data science than I was as a fourth grader, so in this post I’ll use data to finally answer the question “Who is the best character in Mario Kart?”
This is a tricky question because there are tons of potential character / kart / tire configurations now and they all have widely varying stats across a number of attributes. In general, it isn’t possible to optimize across multiple dimensions simultaneously, however some setups are undeniably worse than others. The question for an aspiring Mario Kart champion nowadays is “How can I pick a character / kart / tire combination that is in some sense optimal, even if there isn’t one ‘best’ option?” To answer this question we turn to one of Mario’s compatriots, the nineteenth century Italian economist Vilfredo Pareto who introduced the concept of Pareto efficiency and the related Pareto frontier.
The concept of Pareto efficiency applies to situations where there is a finite pool of resources and multiple competing outcomes that depend on how those resources are allocated. The “Pareto efficient” allocations are those in which it’s impossible to improve one outcome without worsening another outcome. This is more easily explained with a picture (courtesy of Wikipedia).
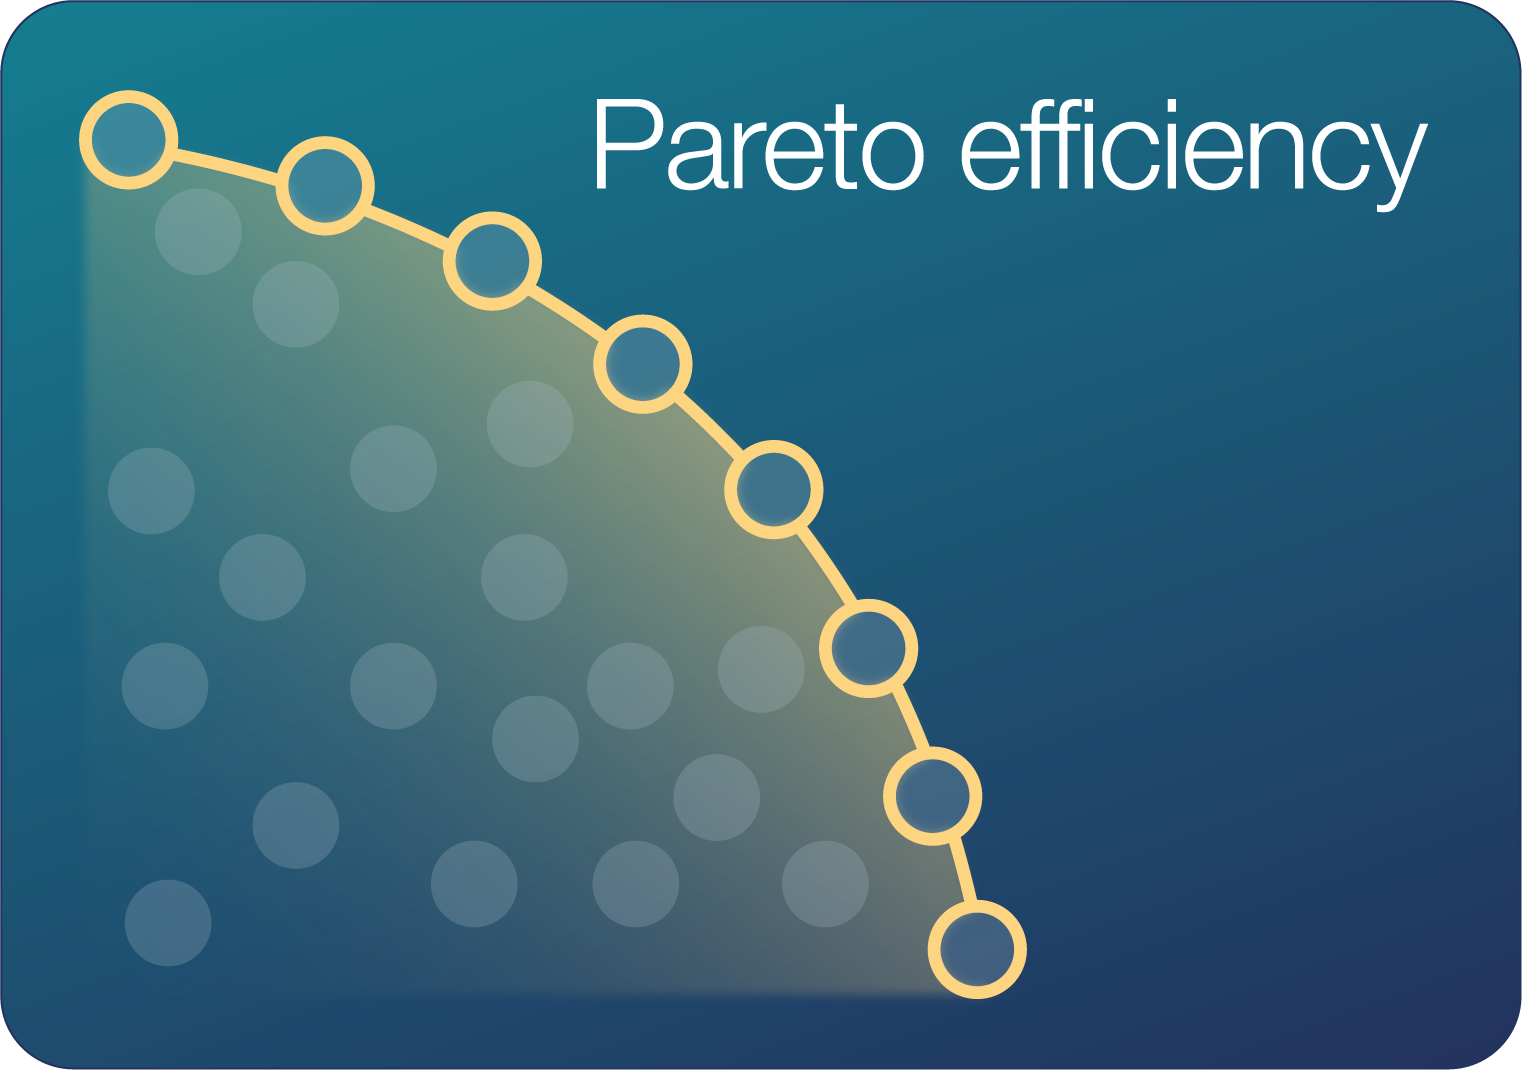
Each circle is a potential resource allocation, which in our case means a distribution of stat points across the different attributes like weight, handling, and traction (characters in Mario Kart have about the same number of total stat points, and differ only in their distribution). The position of each circle represents the outcome of that allocation on two competing dimensions, for example speed and acceleration. The allocations in red lie on the Pareto frontier: for each of these allocations, an improvement in one outcome requires a decrease in the other. Allocations in grey are not Pareto efficient because you can improve both outcomes with a different allocation of resources. Speed and acceleration are generally the two most important attributes in Mario Kart, so the goal of this analysis is to identify the character / kart / tire configurations that lie on the Pareto frontier for speed and acceleration.
We’ll start by examining the stats of each character, kart, and tire independently using some fan-compiled data. One particular quirk of Mario Kart is that while there are a couple dozen characters, many of them have identical stats. From here on out, I’ll refer to the character (or kart, or tire) class by the name of one of its members. For example, in the heatmap below the row labelled ‘Peach’ also describes the stats for Daisy and Yoshi. The complete class memberships are listed at the end of the post in case you want to see where your favorite character lands.
There are seven classes of characters. Let’s have a look at how their stats compare.
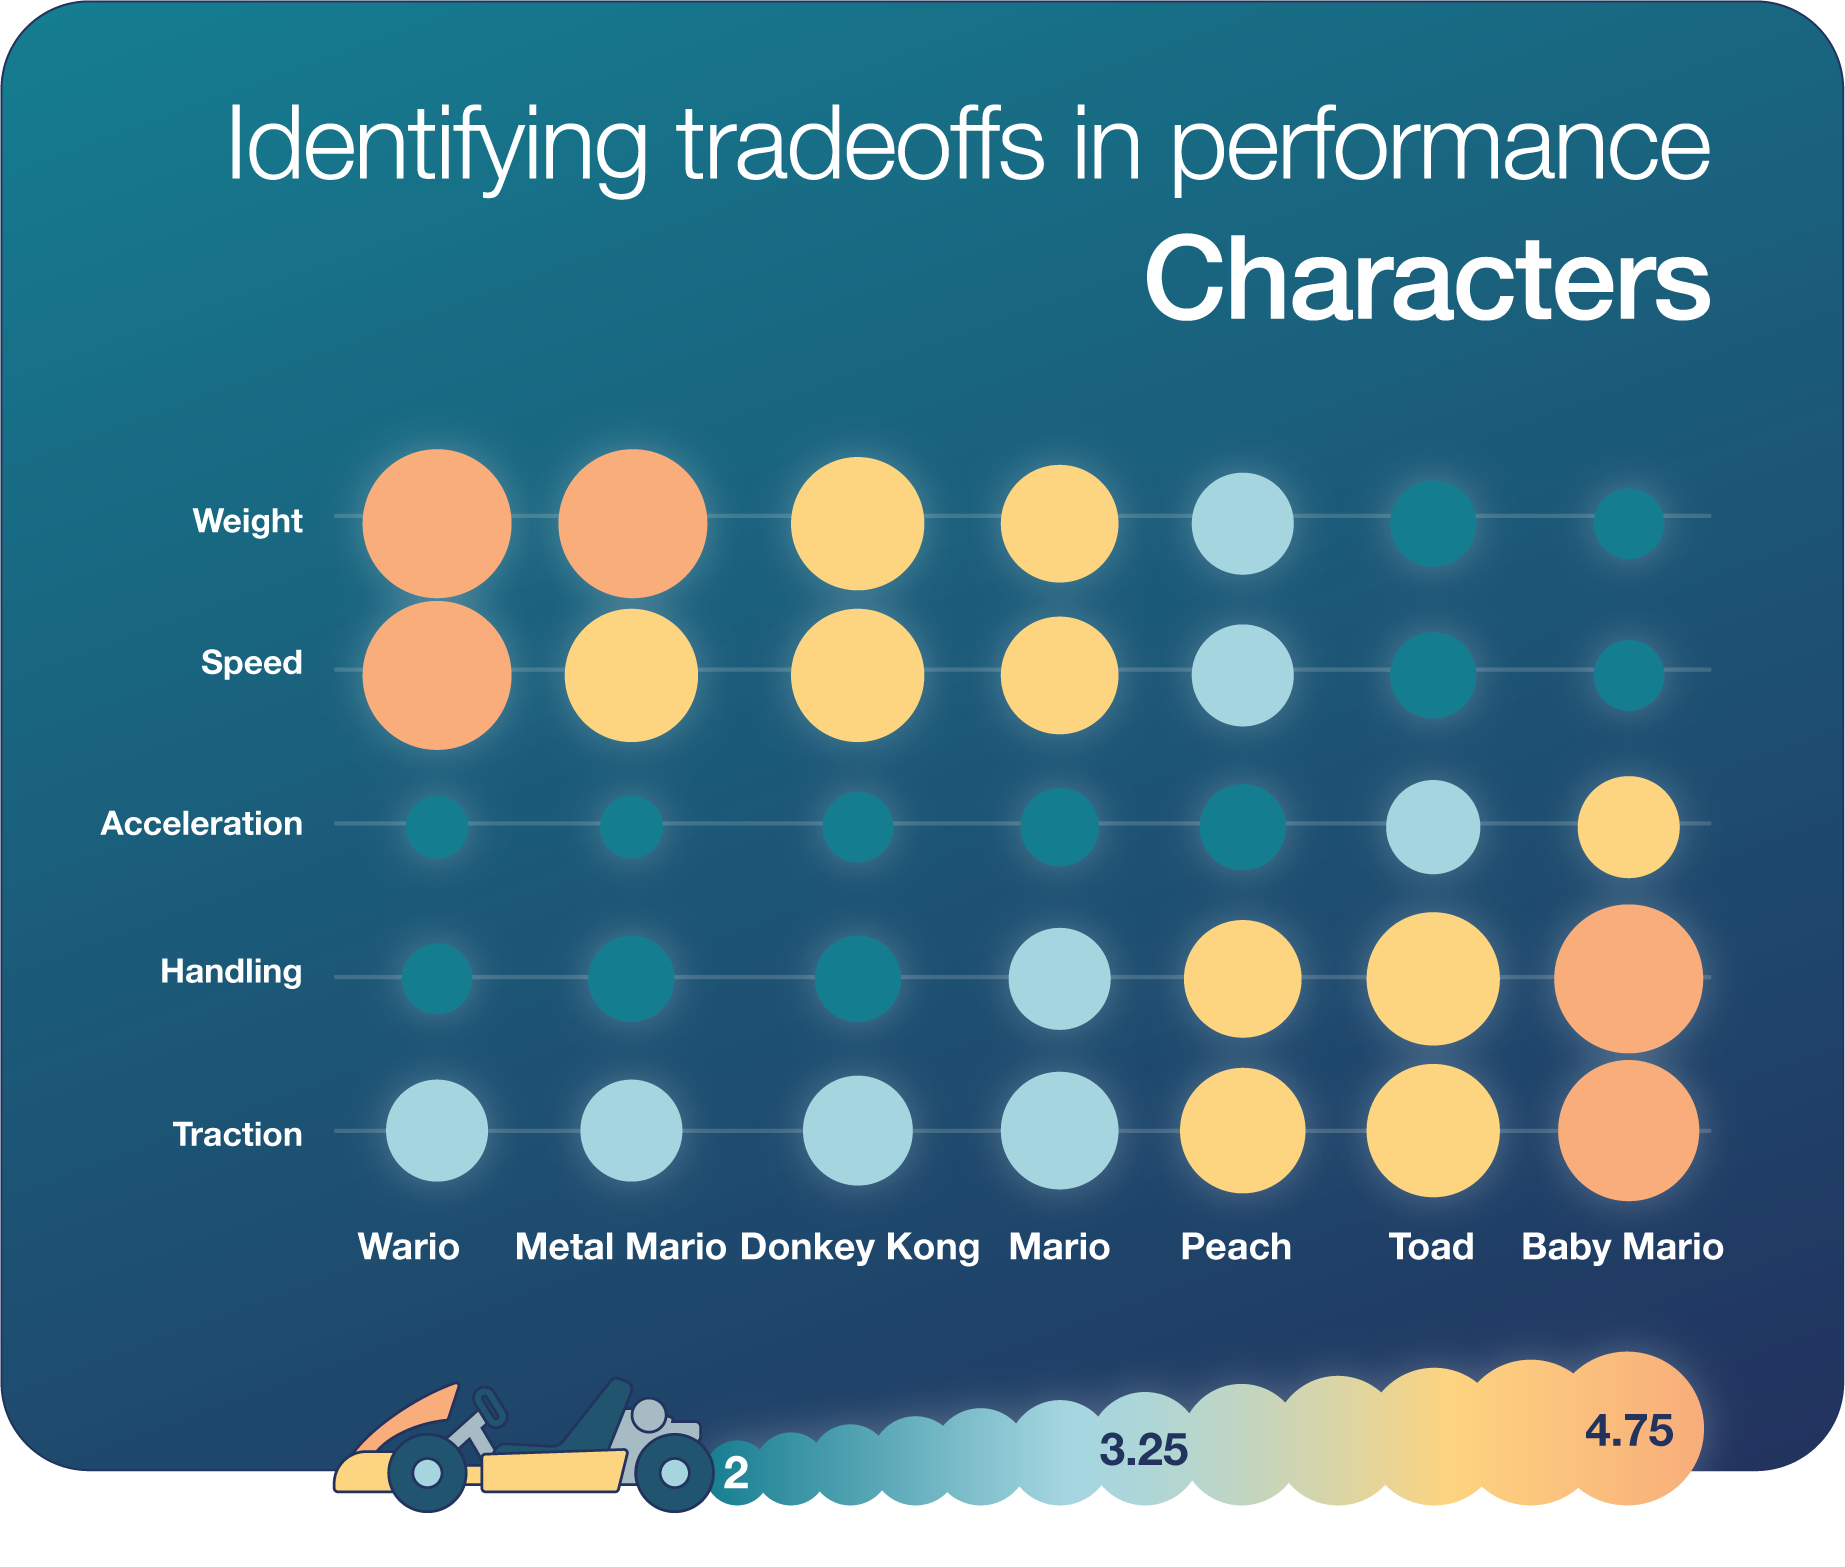
The most obvious trend is the trade-off between speed and acceleration: heavy characters have good speed but poor acceleration, while light characters have snappy acceleration but a low top speed. There are variations in the other stats as well, but to a large extent, the speed and acceleration dominate the performance of a particular set up, so we’ll be ignoring the rest of the stats.
Karts and tires modify the base stats of the characters: the attributes of the final configuration are a sum of the character’s stats and the kart / tire modifiers. As with characters, there are dozens of karts and tires, but only a few categories with different stats.
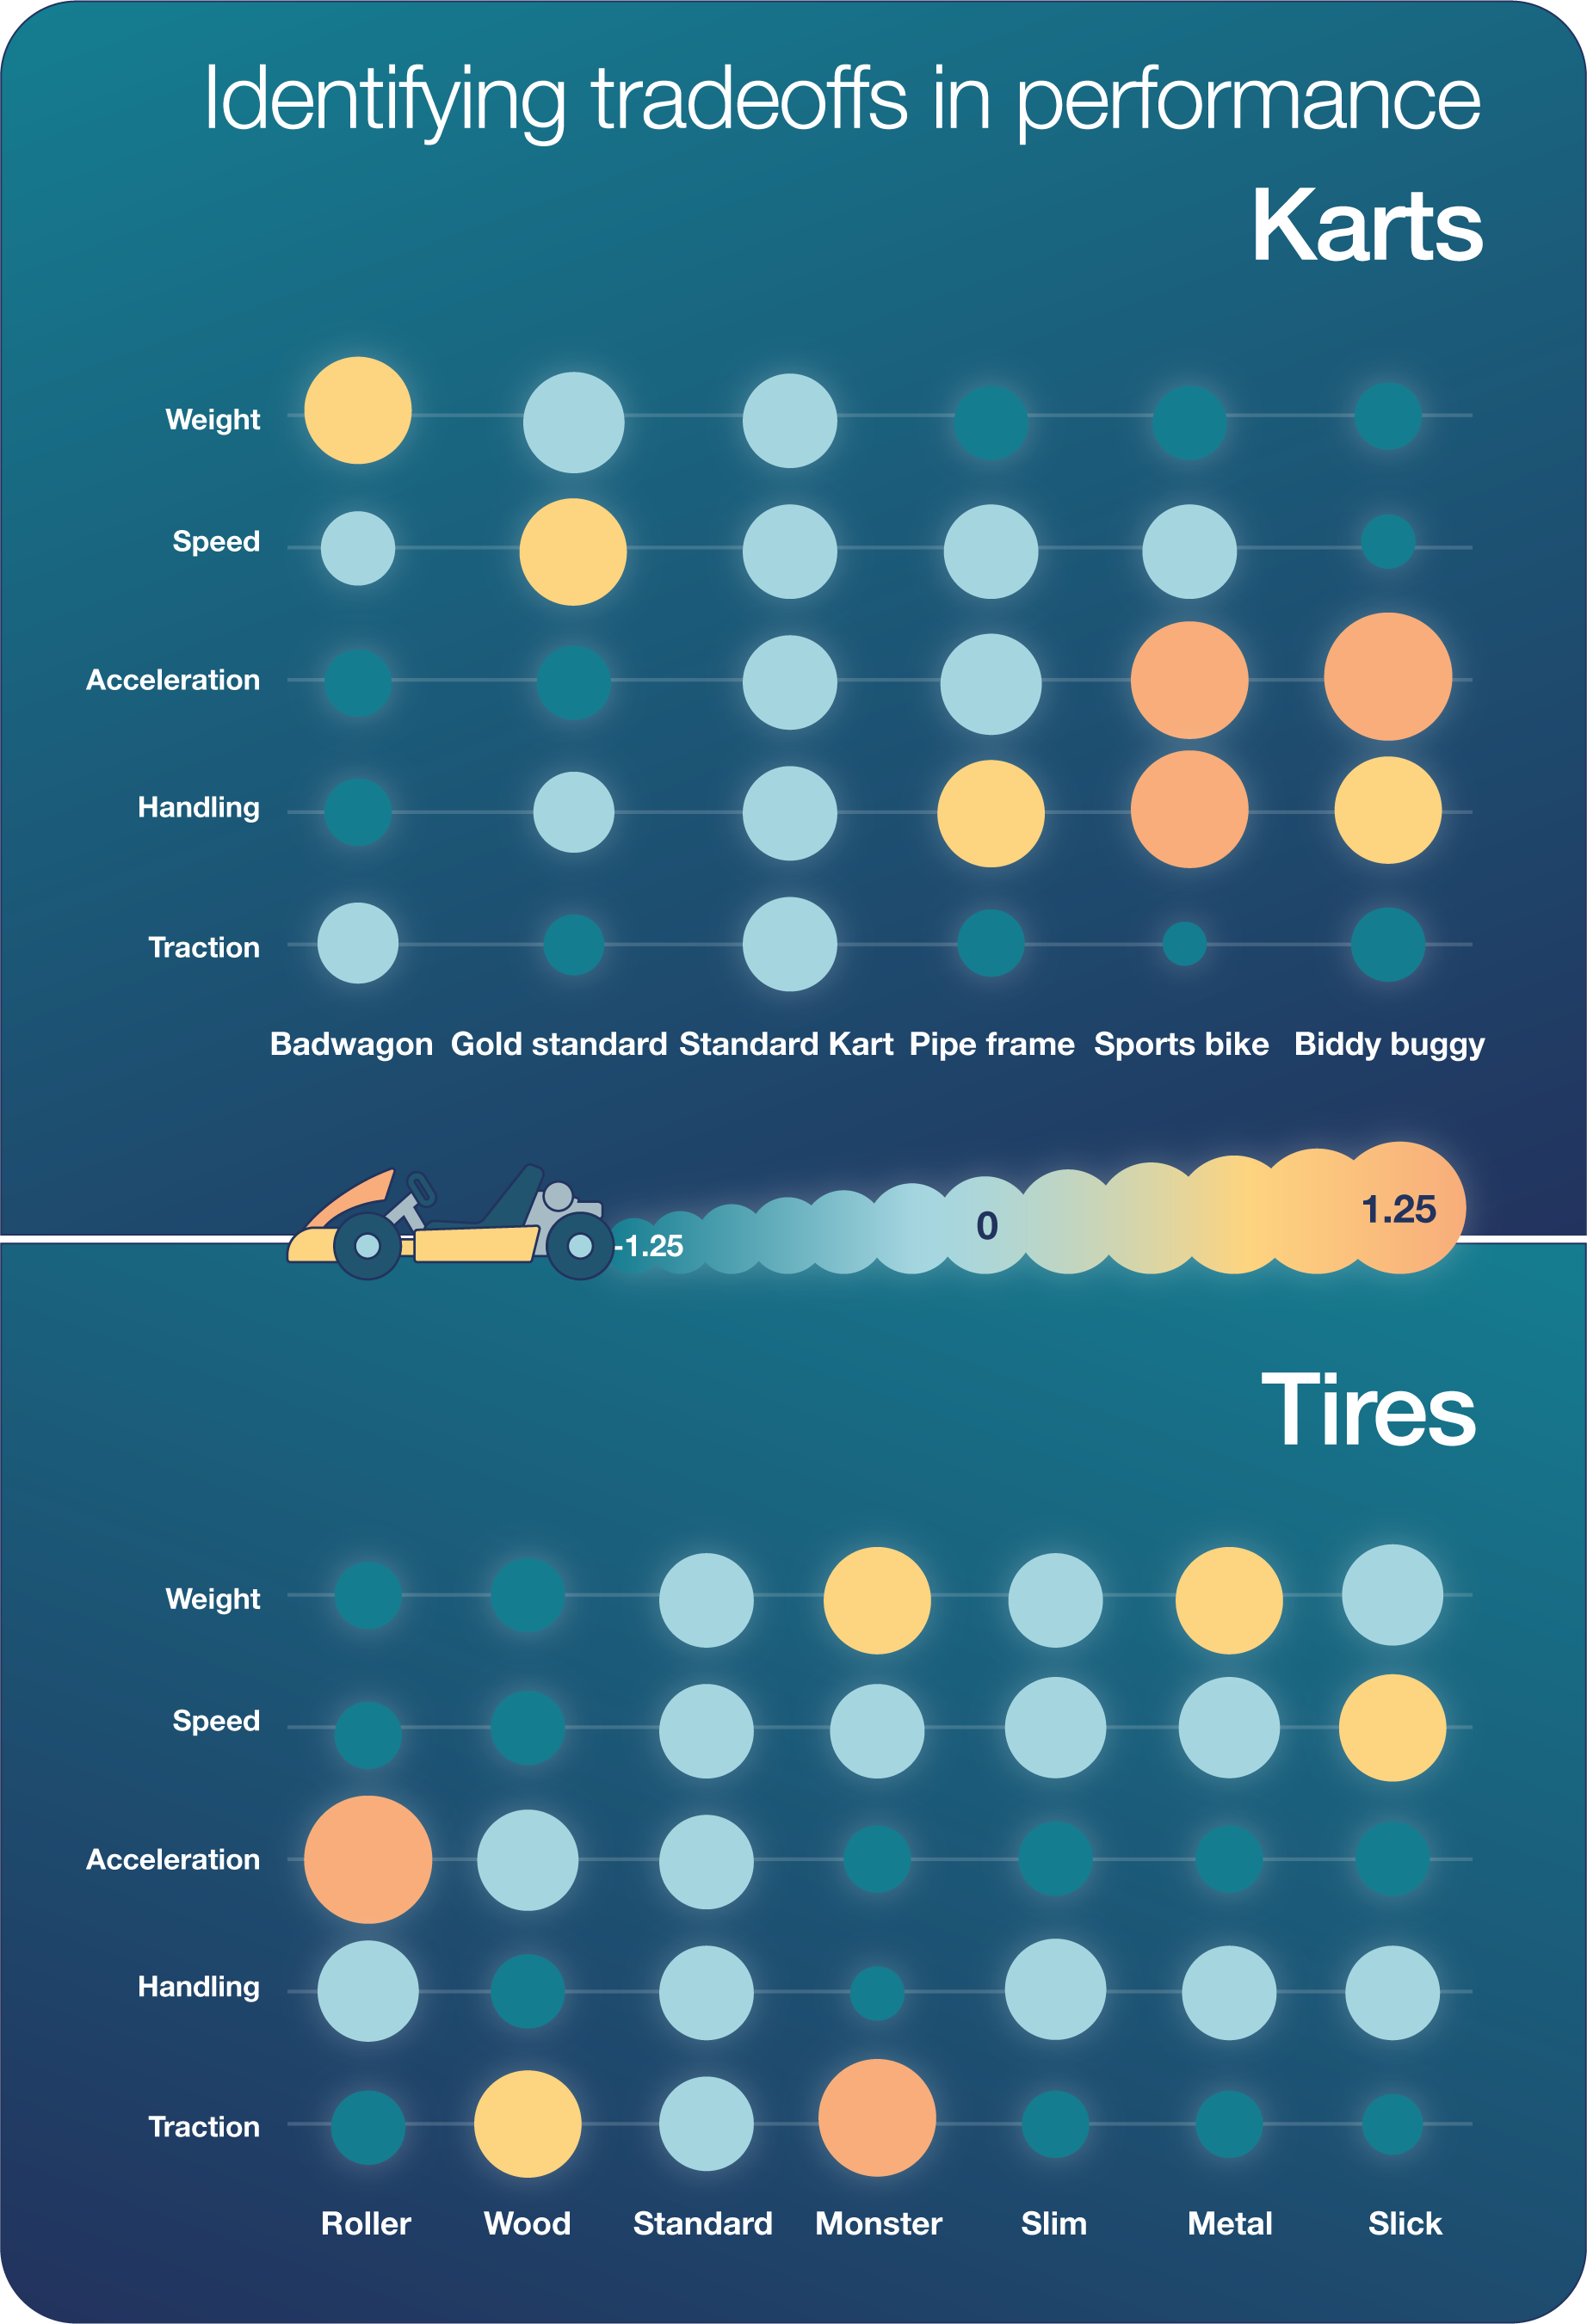
The trends here are less obvious, but they generally agree with what we saw in the character stats: improvements in speed come at the expense of acceleration, and vice versa.
Our goal is to find all the configurations that have an optimal combination of speed and acceleration, so the next step is to compute the stats for each unique (character, kart, tire) combination.
With a little bit of Python we can enumerate all character / kart / tire combinations and calculate their attributes by adding up the values in the figures above. Equipped with the statistics for each possible combination, we can can plot the speed vs. the acceleration of each possible setup, and identify those that lie on the Pareto frontier.
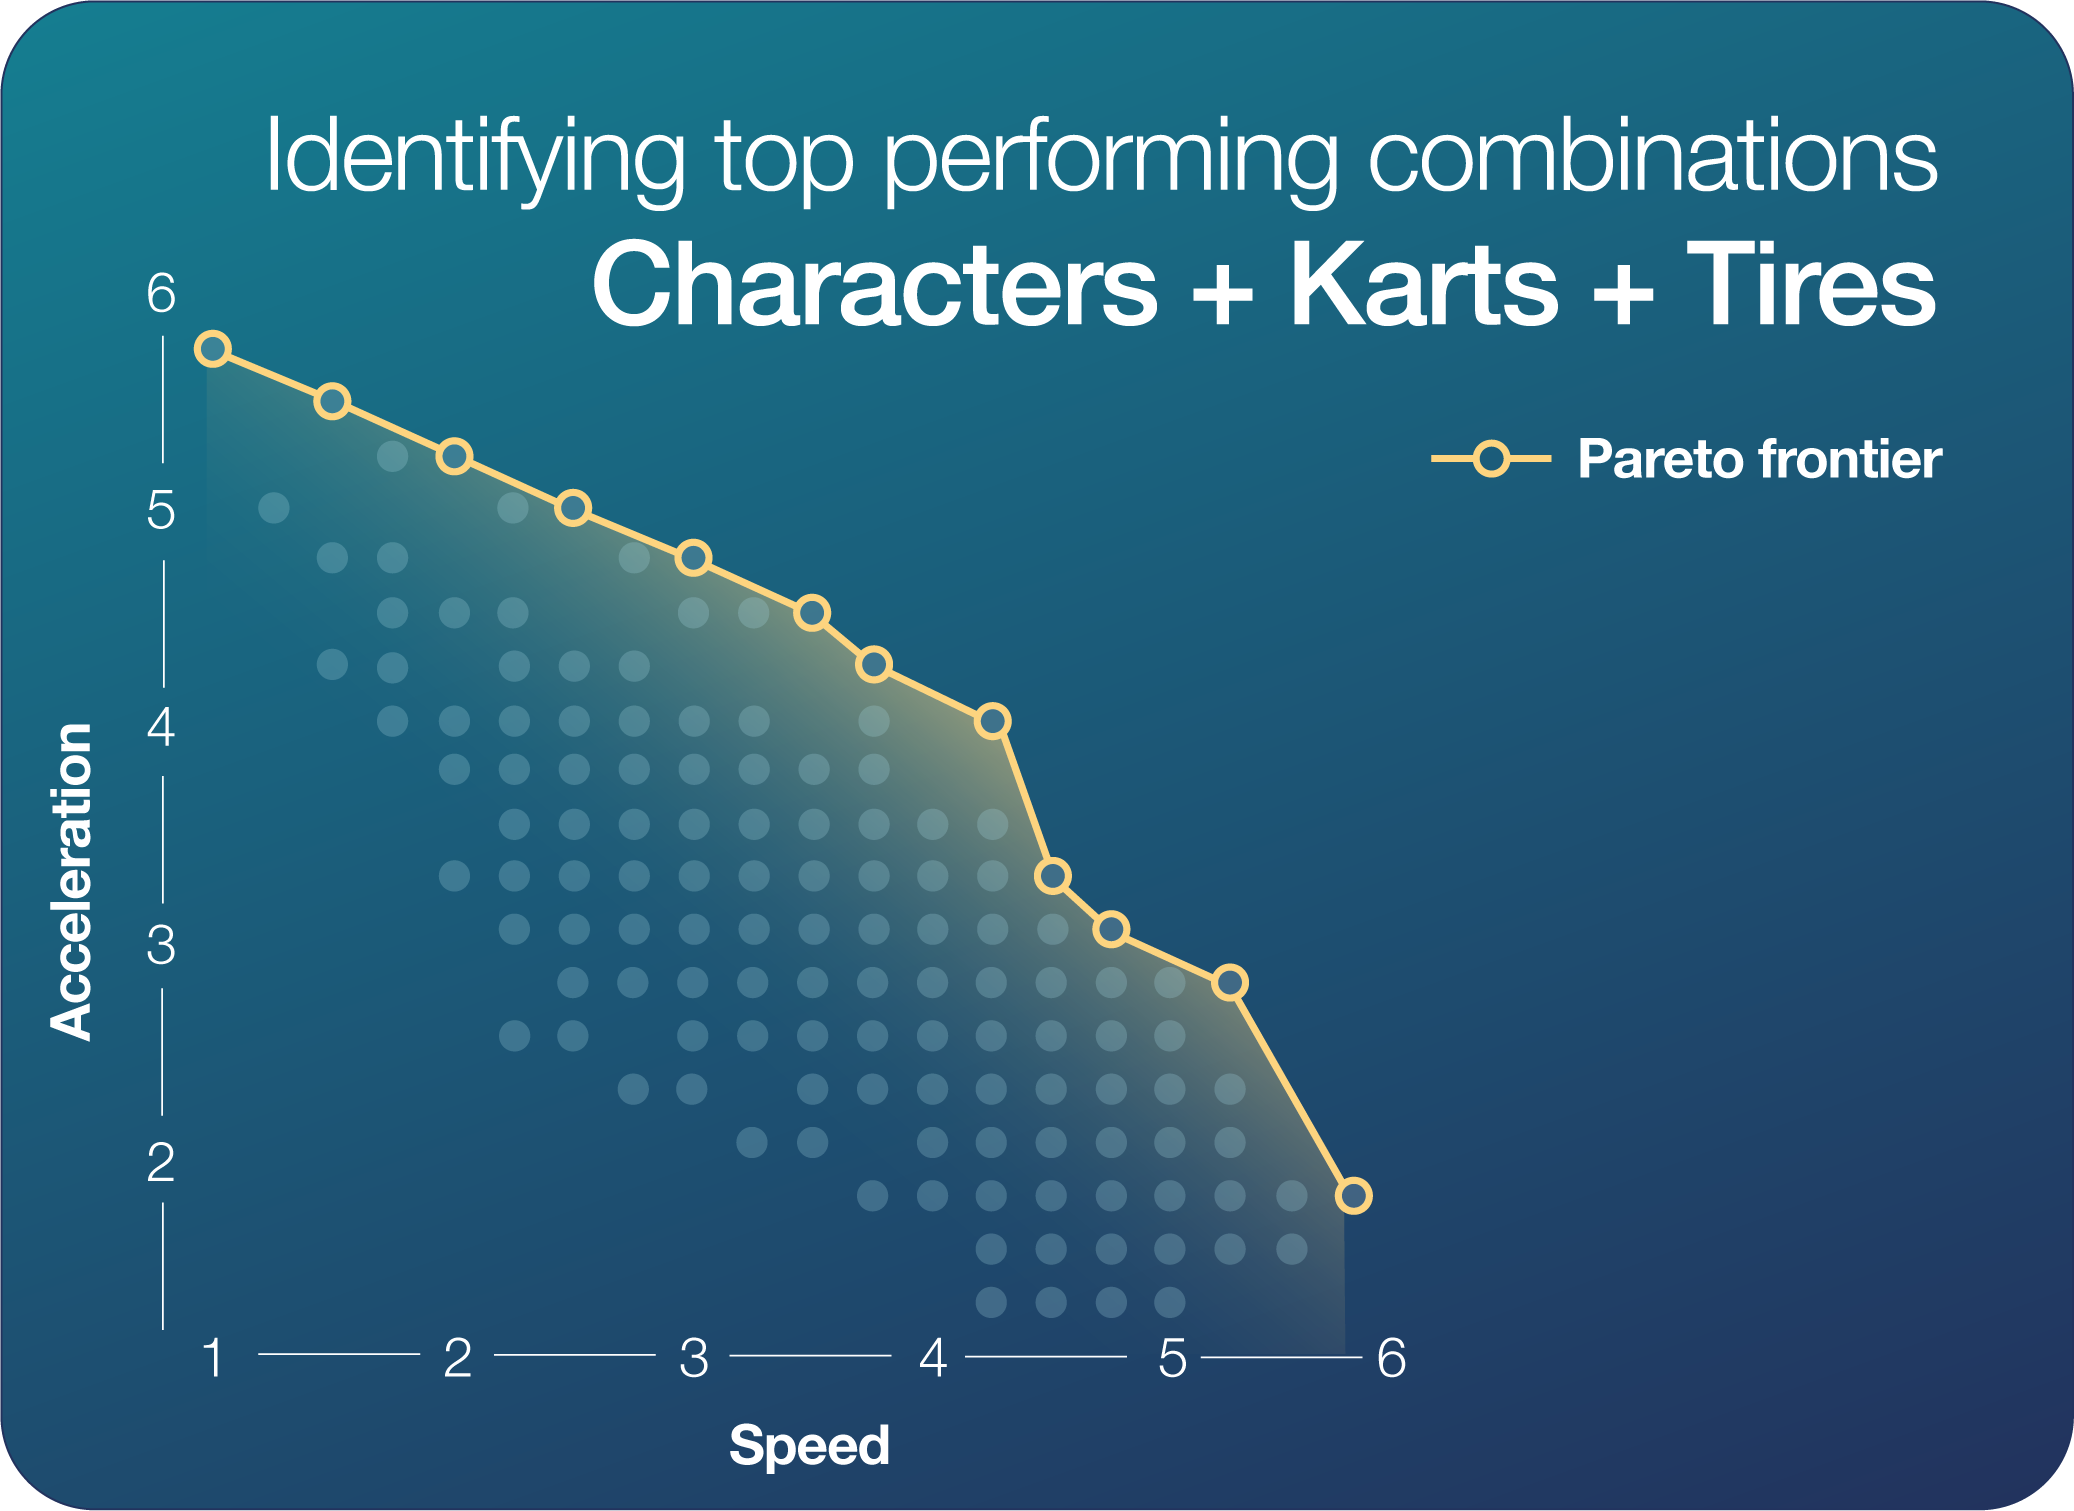
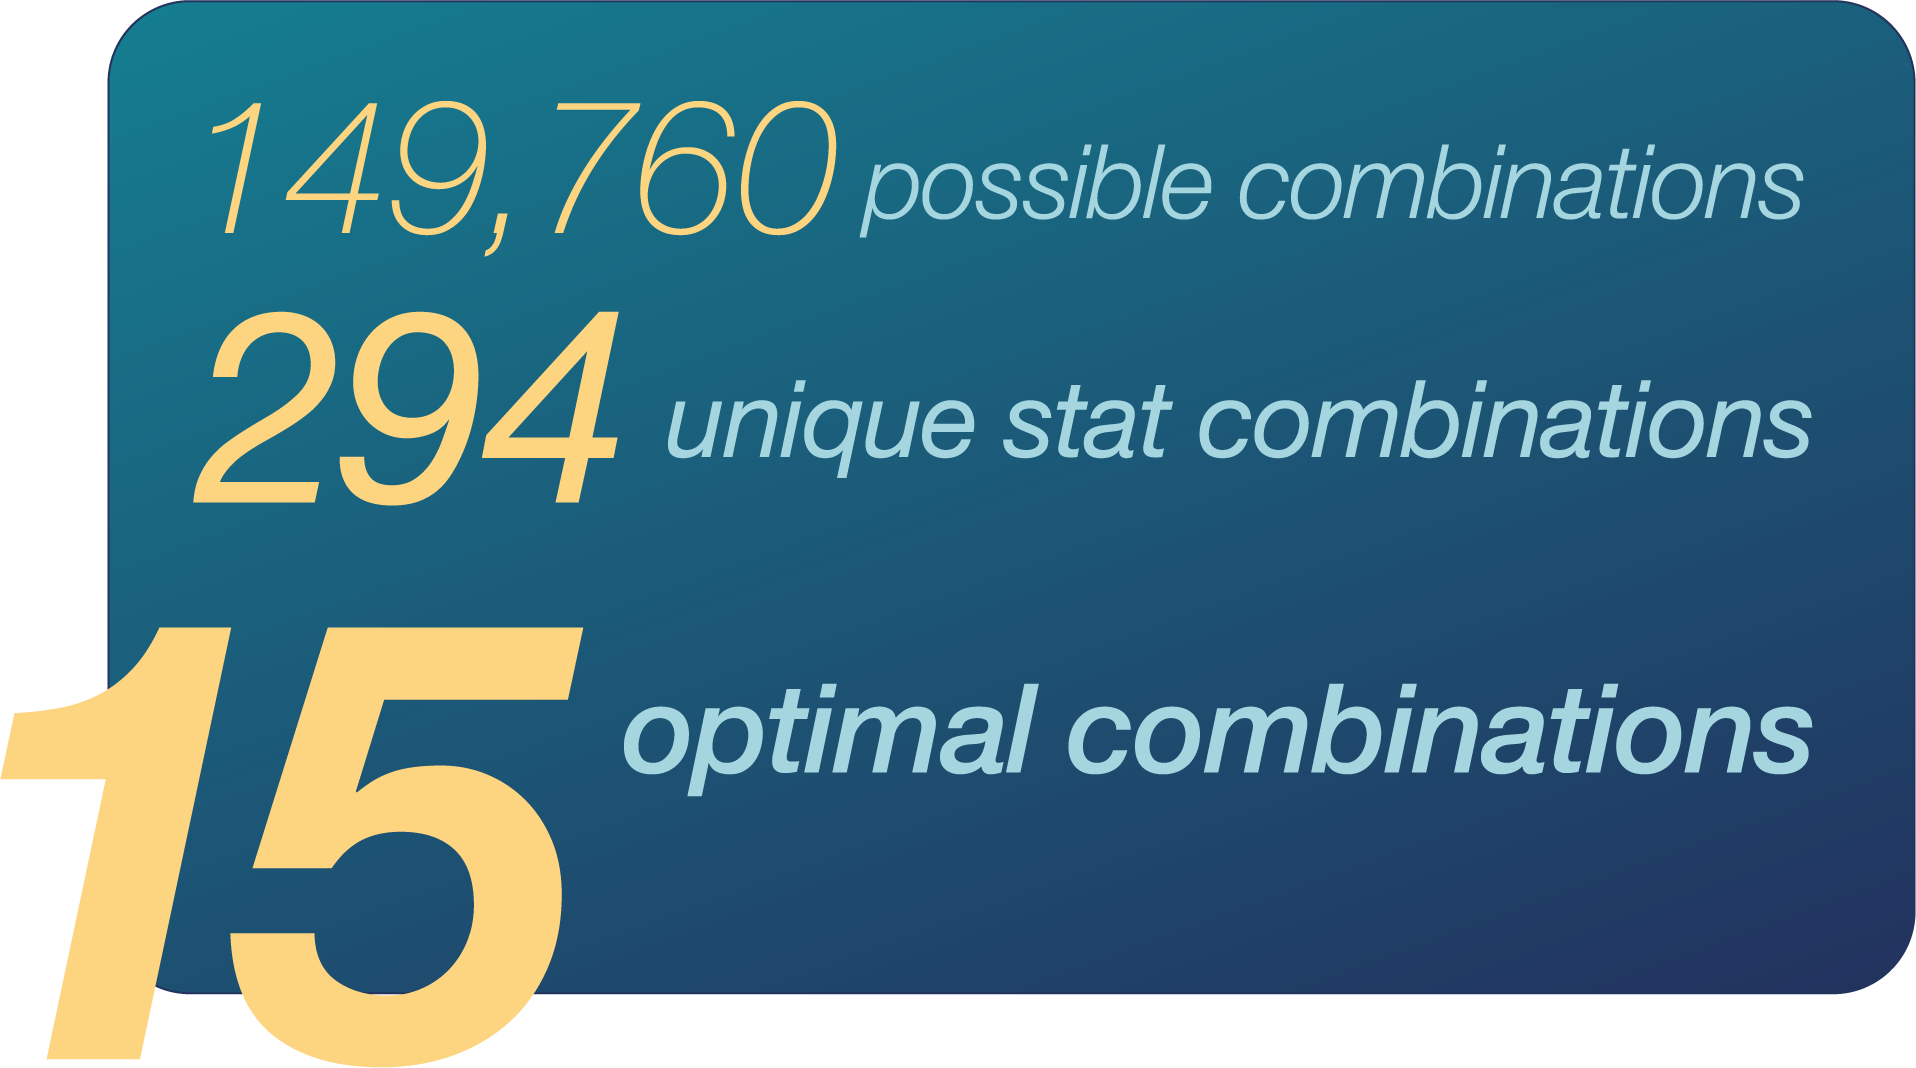
According to the above chart, the optimal configurations make up a fairly small subset of the total possible setups. We can quantify this by counting all the different combinations (note that some combinations overlap in the figure). Just for fun, let’s also count up the possible combinations including all the characters, karts, and tires with identical stats.
Possible combinations: 149760
Unique stat combinations: 294
Optimal combinations: 15
The optimal configurations make up just 5% of the potential unique stat configurations! Let’s have a look at what these optimal configurations look like.
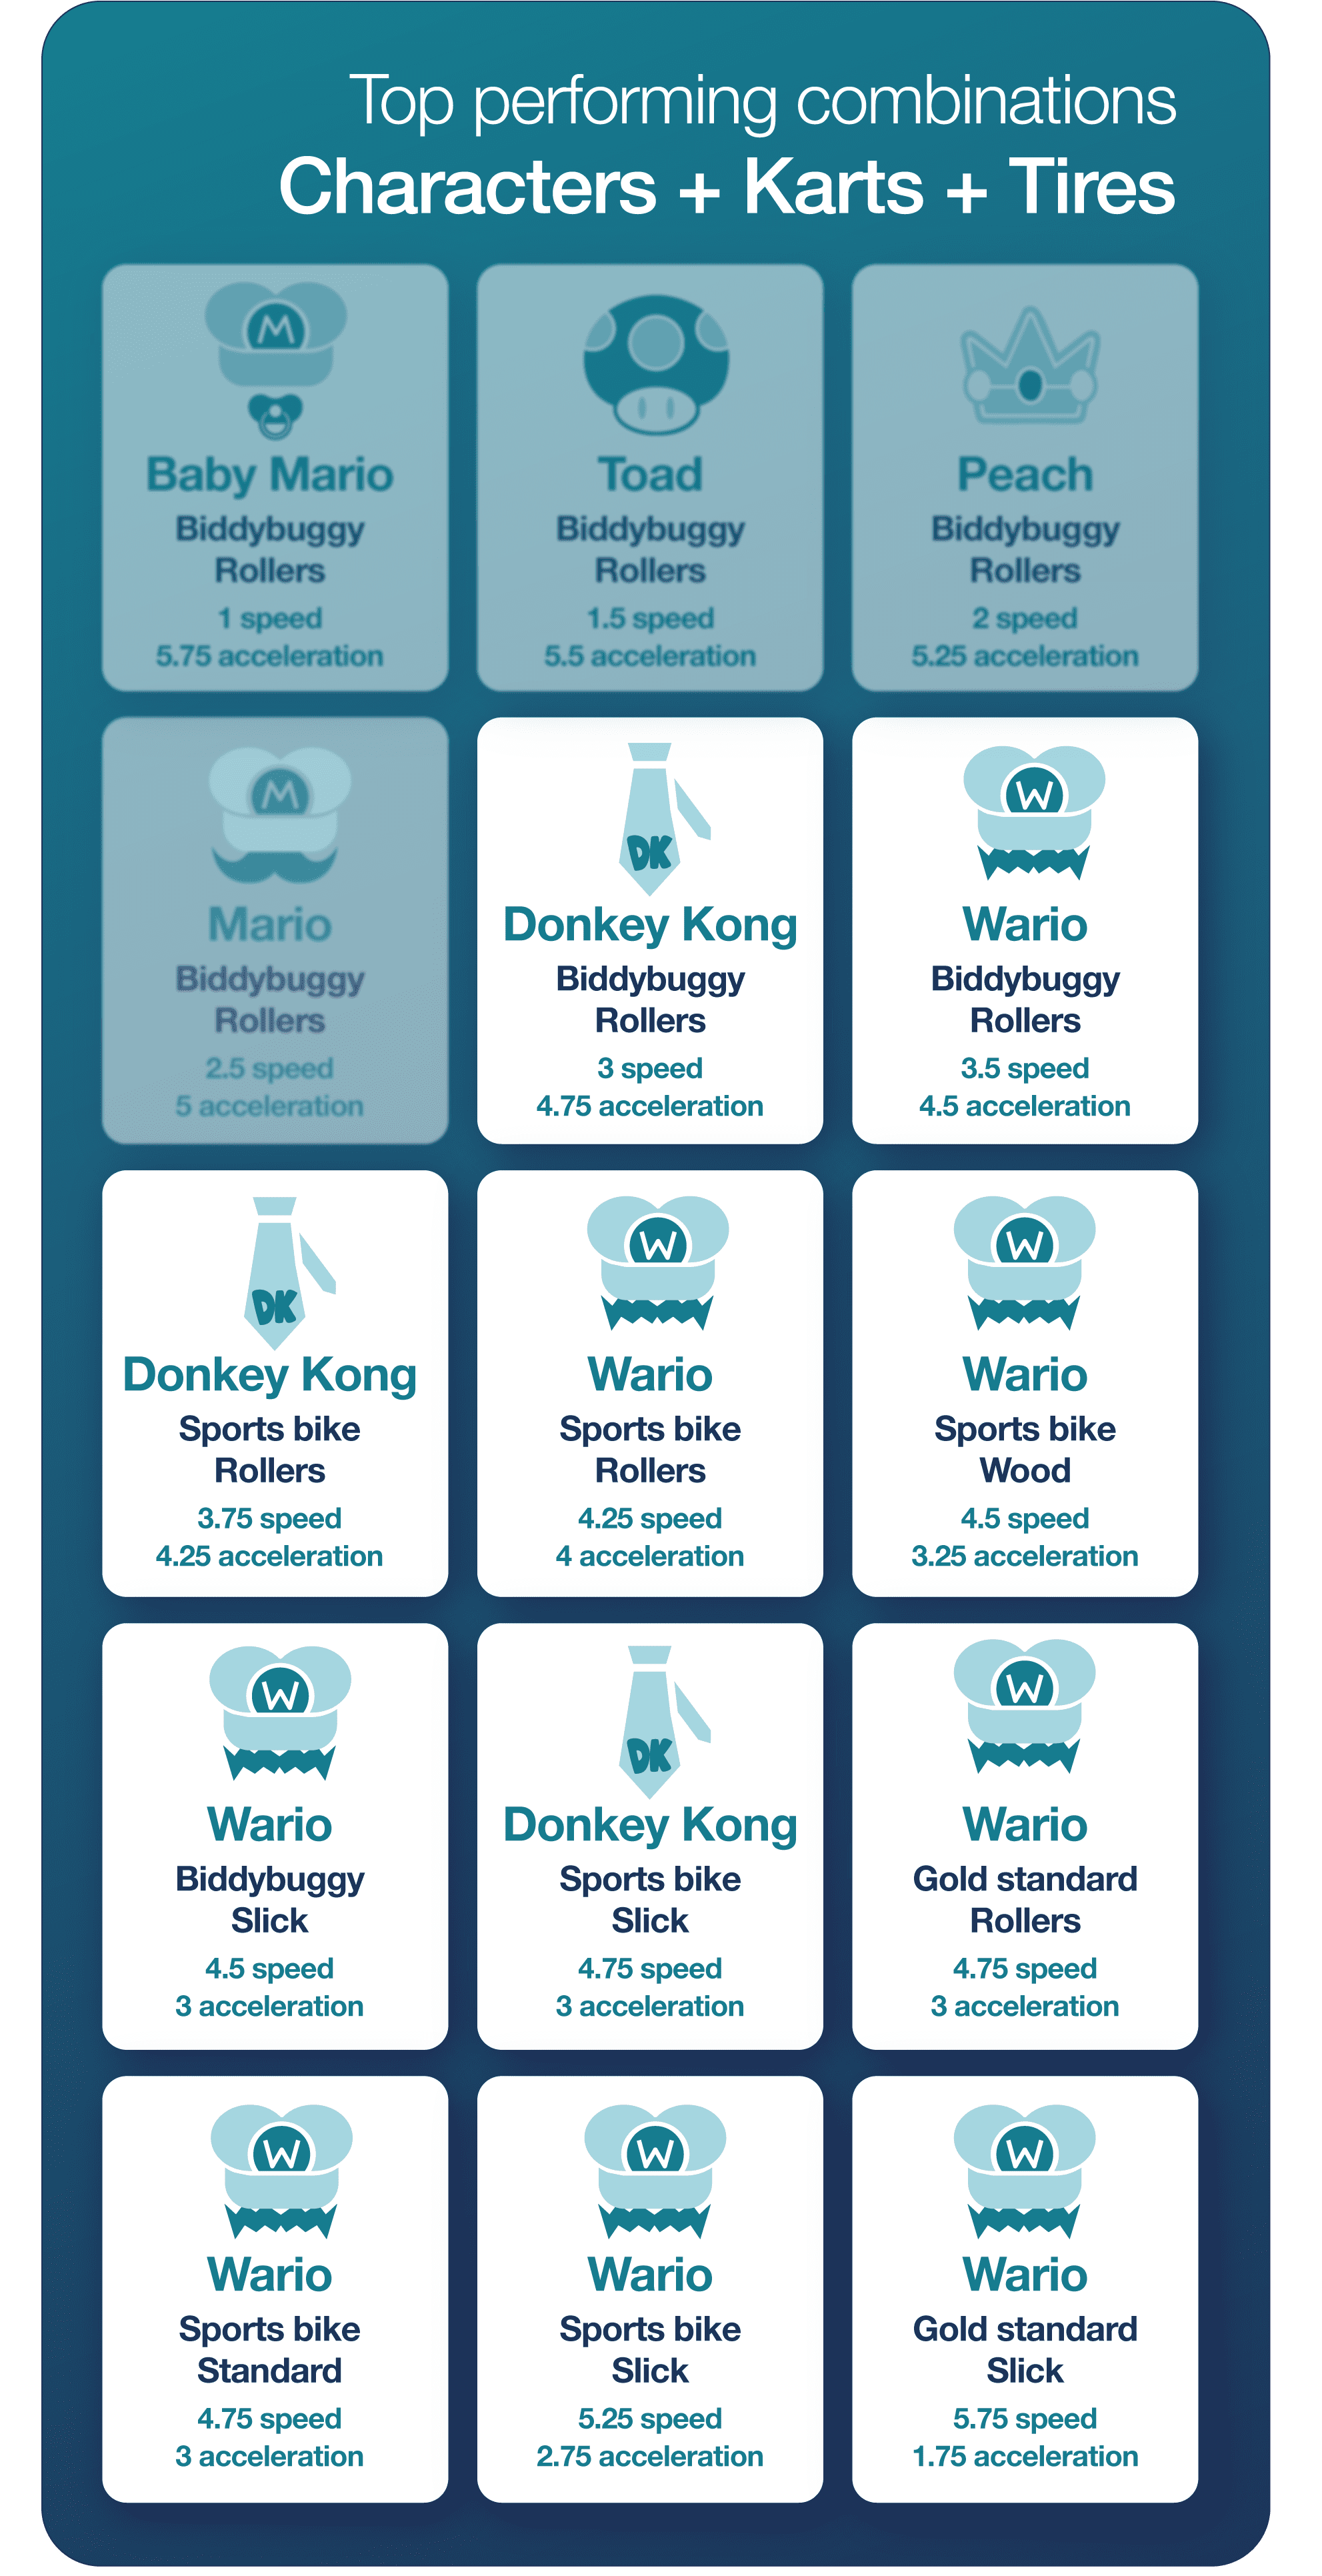
Unless you’re going all-in on acceleration, it looks like a heavy character is the way to go; the two heaviest character classes (Wario and Donkey Kong) account for 11/15 of the Pareto-optimal configurations.
So there it is, if speed and acceleration are your main concerns, then one of these 15 configurations is your best bet.
Sometimes an optimal configuration isn’t what you’re looking for though (say, because your roommate threatened to stop playing if there wasn’t some sort of handicap, to choose a random example). In that case, we can explore all the possible configurations with a quick bokeh interactive graphic.
A few observations:
If you’d like to see the code behind this analysis you can find it here. And finally, in case you have a particular attachment to one of the characters (or karts / tires) you can look up which class he / she / it belongs to below.
Character Classes
*****************
– Baby Mario, Baby Luigi, Baby Peach, Baby Daisy, Baby Rosalina, Lemmy Koopa, Mii Light
– Toad, Shy Guy, Koopa Troopa, Lakitu, Wendy Koopa, Larry Koopa, Toadette
– Peach, Daisy, Yoshi
– Mario, Luigi, Iggy Koopa, Ludwig Koopa, Mii Medium
– Donkey Kong, Waluigi, Rosalina, Roy Koopa
– Metal Mario, Pink Gold Peach
– Wario, Bowser, Morton Koopa, Mii Heavy
Body Classes
*****************
– Standard Kart, Prancer, Cat Cruiser, Sneeker, The Duke, Teddy Buggy
– Gold Standard, Mach 8, Circuit Special, Sports Coupe
– Badwagon, TriSpeeder, Steel Driver, Standard ATV
– Biddybuggy, Landship, Mr. Scooty
– Pipe Frame, Standard Bike, Flame Ride, Varmit, Wild Wiggler
– Sports Bike, Jet Bike, Comet, Yoshi Bike
Tire Classes
*****************
– Standard, Blue Standard, Offroad, Retro Offroad
– Monster, Hot Monster
– Slick, Cyber Slick
– Roller, Azure Roller, Button
– Slim, Crimson Slim
– Metal, Gold
– Wood, Sponge, Cushion