Today, we’re excited to announce General Availability of Civis Creative Focus, our online message testing tool. Now, users in any industry can build better messaging, create more focused advertisements, and generate positive…
The two biggest elections of 2021, those in Virginia and New Jersey, featured Republican turnout levels that significantly surpassed expectations. Back in November, we analyzed the Virginia election, and below we turn our attention to the New Jersey election.
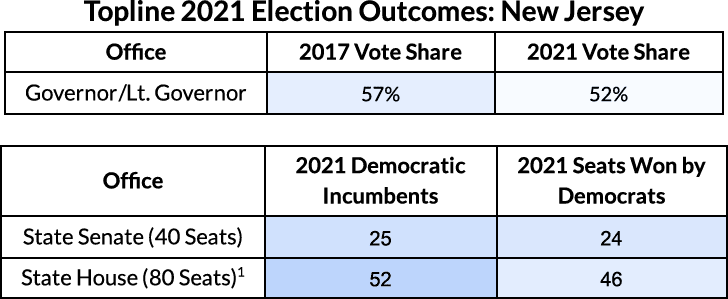
Based on a very strong showing in 2017, Democrats in the Garden State went into Election Night with an incumbent Democratic governor and majorities in both chambers of the state legislature. Democratic support ultimately slipped relative to Trump-era elections, but a strong baseline helped Democrats avoid more significant losses. While incumbent Governor Phil Murphy ultimately won, becoming the first New Jersey Democrat re-elected to the office in decades, Republicans narrowed their statewide losses, picked up seats in the legislature, and knocked off a powerful Senate Democrat.

In this analysis, we pair vote history data released by the New Jersey Secretary of State and acquired from TargetSmart, as well as data from over 13,000 named-candidate survey interviews conducted in New Jersey during the 2021 cycle. These two data sets enable us to understand if Republicans made gains due to changes in who voted (turnout), or who voters supported (vote-switching).
Our analysis shows the answer was both, in roughly equal proportion. Half of Republican gains came from 2017 voters switching their support from Democrats to Republicans and the other half came from different voters turning out this cycle.
In 2021, Democratic turnout increased healthily while Republican turnout surged. The chart below shows raw vote totals in contested State Senate elections in each of the last four cycles2. In 2021, Democrats still earned more votes than Republicans overall, but their margin shrank from +229k votes in 2017 to +11k votes in 2021. Republicans closed the gap by about -218k votes statewide.

Analysis of raw vote totals begs the question: did these changes happen because a new group of voters comprised the 2021 electorate or because of changes in vote choice among existing voters?3
Below, we used Civis’s individual-level State Senate support models, calibrated to reflect actual results at the district level, to estimate how new voters impacted the electorate and how voters who turned out in 2017, but not this year, would have impacted the electorate had they participated.
The table below summarizes four groups of voters and key metrics related to modeled State Senate support in 2021.4

Democrats won the popular vote across contested State Senate races, but by about 218k fewer votes in 2021 than they did one cycle prior. New voters this cycle, who made up four in ten votes cast this cycle, were significantly more Republican overall (netting the party 29k votes) than voters in previous elections. About 500k voters who turned out in 2017 “dropped off” or did not vote again in 2021 and were, as a group, significantly supportive of Democrats, leaving 85k net votes on the table.
These two changes in the composition of the electorate accounted for 114k votes out of the 218k vote gain made by Republicans – about half of the overall change.
While only one New Jersey State Senate seat changed hands overall, almost all districts shifted a few points towards Republicans since 2017’s strong performance among Democrats.
When we applied this analysis method to each state Senate district in New Jersey, we found that not all districts shifted for the same reasons. Most districts that saw small shifts since 2017 can attribute those shifts to changes in turnout, but in districts that have seen much larger changes, vote switching plays more of a role.
The table below shows each State Senate district broken out by how far the district shifted from 2017 to 2021 and the likeliest cause of the shift.

SD-03 (Vote-Switching): State Senate leader Steve Sweeney lost his seat to a first time candidate who only spent $2,200 on the race. Modeling and analysis of vote history data indicates that while turnout played a role in flipping the district from Blue to Red, many of the incumbent senator’s 2017 supporters turned out again, but voted Republican this time.
SD-11 (Turnout): SD-11 was a Democratic flip in 2017, but a narrow hold in 2021 with Democratic vote share dropping from nearly 54% to under 52%. Shifts in turnout drove nearly all of this change. Surging turnout delivered over 1,400 net votes for the Republican.
SD-16 (Vote-Switching): One bright spot on election night was the continued Democratic gains in SD-16, where Democrat Andrew Zwicker defeated former Republican Congressman Mike Pappas following the retirement of incumbent Kip Bateman. The district shifted 4 pts towards Democrats and was one of the few where Surge voters were more Democratic than Republican. We estimate the majority of Democratic gains in this district came from vote switching.
SD-18 (Mixed): This district was competitive in 2013, but swung hard towards Democrats in 2017. This cycle, the district shifted five points towards Republicans, in line with the statewide average. Turnout helped Republicans in this district, but vote-switching drove slightly more of the rightward shift.
The results of elections in New Jersey and Virginia showed us that Republicans are racing to the ballot box, and may also be persuading previous Democratic voters to their sides. It won’t be enough to win in 2022 through turning out Democrats – persuading new voters is critical.
We’re happy to review our findings in more detail and brainstorm ways Democrats can leverage always-on research and message testing to deliver on both persuasion and turnout to win in 2022.