Today, we’re excited to announce General Availability of Civis Creative Focus, our online message testing tool. Now, users in any industry can build better messaging, create more focused advertisements, and generate positive…
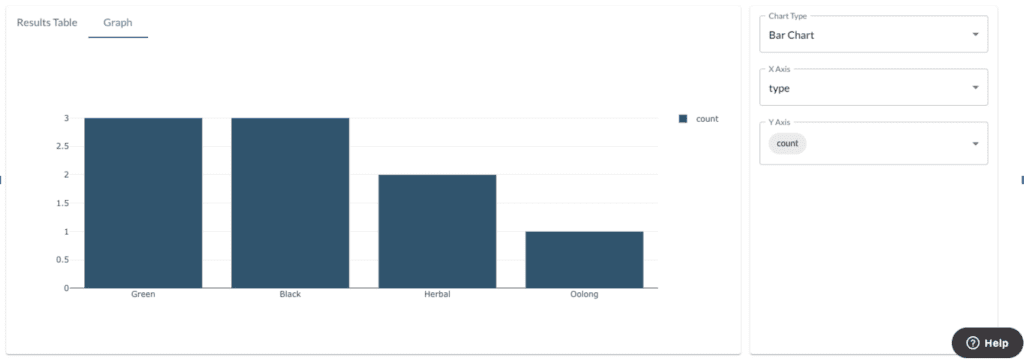
We are excited to announce the launch of SQL-based reporting in Civis Platform! This feature enables you to quickly create reports based on your data in Civis Platform without needing to connect to a third-party service.
We understand how important reporting is to you – it is integral to your day-to-day work, aids in understanding trends and patterns, empowers you to make data-driven decisions, and unlocks insights to maximize your impact. SQL-based reporting brings all of that, and more, to the forefront of Civis Platform’s web interface.

This is an additional offering to our existing reporting tools. Tableau-powered reporting and Platform Services can – and likely will – still play a large role in your data journey. You will still have access to Tableau, including the dashboards you have already set up, and Platform Services will continue to offer customizable reports which can be made public for external stakeholders.
SQL-based reporting will be a valuable addition to your data exploration and analysis. This tool shines when used in quick and agile iterations to extract meaningful insights and draw conclusions from your data. Plus, you can also customize and download the visualization to share with others.
SQL Reports are now available to our Civis Platform end users. For more information on how to use SQL-based reporting, see this help article.
We look forward to seeing how you leverage SQL Reports in your data journey to drive positive change – happy visualizing!

If you’re excited about sharing more of the data that is driving your work with your stakeholders, we invite you to reach out to our team of experts. Let us guide you through the process, answer any questions you may have, and help you create and share your services.